
At 2 a.m., a Linux host starts showing intermittent latency, disk usage keeps climbing, and a kernel oops is buried in a flood of service messages. One engineer tails a file under /var/log, another checks the system journal, and a third searches a central collector. The incident isn't difficult because Linux can't log the event. It's difficult because the logging path, storage policy, and forwarding design weren't treated as one system.
System logging in Linux starts with understanding that path. Records originate in the kernel, services, libraries, and applications. They pass through journald, a traditional syslog daemon, or both, then land in persistent local storage or a central destination. The right design depends on whether the host needs structured queries, text files, protocol forwarding, long local retention, or fast multi-host correlation.
This guide focuses on the decisions that matter during production work: how records travel, when to use journald, rsyslog, or syslog-ng, how to query with journalctl, how retention affects forensics, and how forwarding connects local Linux sources to centralized streams and investigation interfaces. For a related security-focused treatment, see this guide to audit logging on Linux.
Table of Contents
- Why Linux Logging Architecture Matters for On-Call Engineers
- How Linux System Logging Actually Works
- Choosing Between journald, rsyslog, and syslog-ng
- Practical journalctl and logger Commands for Daily Use
- Log Rotation, Persistence, and Retention Strategy
- Forwarding Linux Logs Over Syslog, HTTP, GELF, and OTLP
- Investigating Centralized Linux Logs in Live Tail and via MCP
Why Linux Logging Architecture Matters for On-Call Engineers
Tailing /var/log/messages can answer a narrow question on one host. It breaks down when dozens of services write to different destinations, when a reboot removes volatile history, or when an incident requires correlation between kernel messages, authentication events, unit failures, and application errors. Plain-text search also struggles with metadata such as process identity, boot ID, user ID, and service ownership.
The operational mistake is treating logging as a command-line habit rather than an architecture. Before selecting a daemon, an engineer needs to decide:
- Where records originate: kernel output, service managers, libraries, applications, or network devices.
- Where records live: volatile journal storage, persistent journal files, traditional files, or a remote collector.
- How records travel: local sockets, syslog forwarding, HTTP, GELF, OTLP, or another supported path.
- How operators investigate: host-local queries, centralized search, Live Tail filtering, alerts, or agent-assisted analysis.
Practical rule: Local logs are useful for immediate diagnosis. They aren't a complete incident record until persistence, retention, and forwarding have been designed together.
A host with ephemeral storage needs a different policy from a long-lived database server. A small estate may run journald alone, while a mixed estate may need a relay daemon to normalize and forward records. Production logging also needs a failure plan. If the collector is unavailable, the local queue, journal, or file destination must protect the most important events without allowing a log storm to consume the root filesystem.
The architectural map is straightforward. First, identify the producer and metadata. Next, choose the local daemon and storage mode. Then set limits, verify post-reboot behavior, and configure forwarding. Finally, investigate centrally using exact fields rather than broad text searches.
How Linux System Logging Actually Works
A Linux log record can begin in the kernel ring buffer, which applications can access through /dev/kmsg, or in a user-space process calling the libc syslog(3) interface. Traditional applications commonly send those messages through the /dev/log UNIX datagram socket. On systemd systems, journald provides a journal socket at /run/systemd/journal/dev-log and collects service output, kernel messages, and structured metadata.
The traditional syslog header carries two routing dimensions:
- Facility:
auth,cron,daemon,kern,mail,syslog,user, andlocal0throughlocal7. - Severity:
emerg,alert,crit,err,warning,notice,info, anddebug.
The familiar facility.priority model comes from the BSD syslog design introduced in 1983, and it still shapes log categorization. The IETF documented the long-standing behavior in RFC 3164 in August 2001, then obsoleted it with RFC 5424 in March 2009, an eight-year move from convention to a standards-track specification. These milestones are documented in the history of syslog.
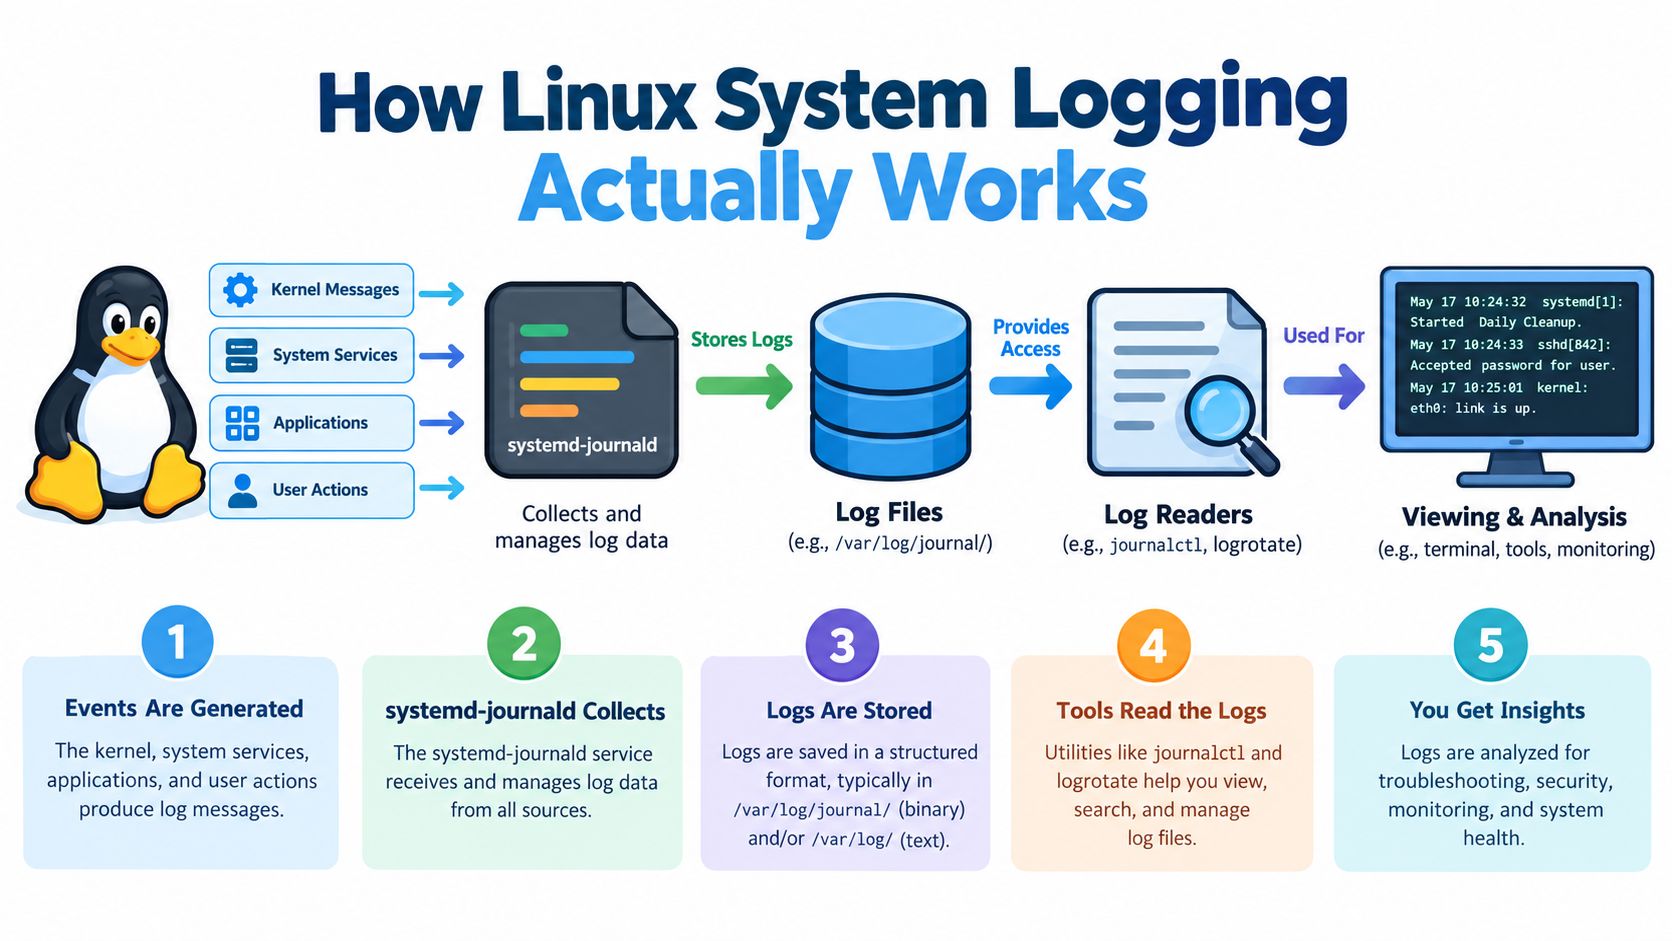
journald stores binary journal records rather than ordinary line-oriented files. Fields can include MESSAGE, PRIORITY, _PID, _UID, _BOOT_ID, _HOSTNAME, and transport metadata, which lets journalctl filter by structured identity instead of relying only on message text.
RFC 3164 timestamps lack a year and timezone. RFC 5424 adds structured data and an RFC 3339-style timestamp with year, timezone, and sub-second precision, reducing ambiguity when logs from different regions are correlated. rsyslog grew from BSD syslogd, with roots in 1983, and was created in 2004 to address production requirements including reliable TCP transport, flexible output, database integration, and higher performance, as described in the rsyslog origins documentation.
Choosing Between journald, rsyslog, and syslog-ng
The daemon choice should follow the operational boundary, not habit. journald is the natural local collector on systemd hosts because it understands units, boot sessions, process metadata, and structured fields. rsyslog and syslog-ng become more useful when the host must relay records, apply routing rules, transform formats, or speak several transport protocols.
| Criterion | journald | rsyslog | syslog-ng |
|---|---|---|---|
| Primary role | Local systemd journal | File writer, router, and relay | Declarative router and relay |
| Storage model | Binary, indexed journal | Text files and queues | Text, destinations, and relay pipelines |
| Query style | journalctl field and time filters |
File tools and downstream collectors | Destination and source configuration |
| Routing model | Journal fields and forwarding options | RainerScript, templates, modules | Declarative SCL configuration |
| Forwarding fit | Best as local collector or handoff point | Broad forwarding and output surface | Strong relay and transformation design |
journald's default storage mode is auto. It writes persistently under /var/log/journal/ only when that directory exists. Otherwise, it uses volatile storage under /run/log/journal/, which is lost during reboot. The behavior and the journalctl --flush mechanism are documented in the systemd-journald service documentation.
rsyslog is a practical choice when existing applications expect traditional files or when routing requires queues, templates, and output modules. syslog-ng suits estates that prefer declarative source, filter, and destination definitions, especially where a dedicated relay tier separates collection from application hosts.
A direct selection guide
- Minimal systemd hosts: journald alone is usually sufficient when local querying and controlled forwarding meet the requirement.
- Mixed estates: journald on the host with rsyslog as a relay keeps legacy file and syslog workflows available.
- High-volume or security-sensitive relays: syslog-ng or rsyslog can provide a deliberate routing tier with explicit destinations and transport choices.
No daemon removes the need for retention planning. A powerful relay with no durable queue still loses records when its destination fails, while a well-configured journal can still lose post-reboot history if persistence isn't enabled.
Practical journalctl and logger Commands for Daily Use
journalctl becomes useful when queries narrow the search before output reaches the terminal. A time window is usually the first filter:
journalctl --since "30 minutes ago" --until now
For a service-specific incident, combine the unit, priority, and time range:
journalctl -u nginx.service -p warning --since "1 hour ago"
The -p option accepts a severity or range. This command shows warnings and more severe events:
journalctl -p warning..emerg --no-pager
Follow a service while reproducing the fault:
journalctl -u nginx.service -f
Structured fields provide better precision than searching every rendered line. Examples include:
journalctl _TRANSPORT=kernel
journalctl _UID=1000
journalctl SYSLOG_IDENTIFIER=auth
Use journalctl -o json when a script needs fields rather than terminal formatting. journalctl -k narrows output to kernel messages, while journalctl -b -1 examines the previous boot, provided that history still exists locally.
Inspecting space and controlling a storm
Start with current usage:
journalctl --disk-usage
A manual cleanup can target size or age:
journalctl --vacuum-size=500M
journalctl --vacuum-time=2weeks
Permanent rate limiting belongs in /etc/systemd/journald.conf. Rate limiting applies per service, not globally. If a service exceeds RateLimitBurst= within RateLimitIntervalSec=, journald drops further messages during that interval and records a dropped-message notice. The documented default is 10,000 messages in 30 seconds, according to the Linux Professional Institute journald material.
An illustrative, deliberately stricter setting is:
RateLimitIntervalSec=30s
RateLimitBurst=1000
After editing, restart journald carefully:
sudo systemctl restart systemd-journald
To inject a controlled test event during triage:
logger -t auth -p auth.warning "illustrative incident-triage message"
The test confirms facility, tag, severity, and downstream routing without requiring an application change.
Log Rotation, Persistence, and Retention Strategy
Retention has two separate jobs. It prevents local storage exhaustion, and it preserves enough history to investigate what happened before an incident. Traditional files such as /var/log/auth.log, /var/log/syslog, and daemon-specific logs generally use logrotate, while journald applies filesystem-aware journal limits and vacuuming.
A traditional policy might look like this:
daily
rotate 14
compress
missingok
postrotate
    systemctl kill -s HUP rsyslog.service
endscript
The exact policy should match the daemon and distribution. The important distinction is that rotation renames or removes files, while the daemon must reopen or reload destinations when required.
| Knob | logrotate in /etc/logrotate.conf |
journald in /etc/systemd/journald.conf |
|---|---|---|
| Age control | daily, weekly, or another schedule with rotate |
MaxRetentionSec= or manual --vacuum-time |
| Size control | Rotation rules and file size options | SystemMaxUse= and SystemMaxFileSize= |
| Free-space protection | External filesystem policy | SystemKeepFree= |
| Compression | compress |
Journal's binary storage and configured compression behavior |
| Reload behavior | postrotate hook |
Managed by journald |
For persistent journal storage, create /var/log/journal/ and verify the result with:
journalctl --flush
journalctl --disk-usage
SUSE documents a default ceiling of up to 10% of the filesystem containing /var/log/journal/ when SystemMaxUse= isn't set. SystemKeepFree= and SystemMaxFileSize= further constrain retention and file rollover, as described in the SUSE journalctl documentation.
An explicit policy can combine:
Storage=persistent
SystemMaxUse=2G
SystemKeepFree=1G
MaxFileSec=1month
--vacuum-size removes older archived data until a size target is met. --vacuum-time removes entries older than an age target. Neither substitutes for forwarding. Local retention may be enough for a short-lived batch host with a disposable investigation window. Forwarding becomes mandatory when compliance, multi-host correlation, node replacement, or ephemeral disks make local history unreliable.
Forwarding Linux Logs Over Syslog, HTTP, GELF, and OTLP
Forwarding starts with a clear destination contract. The sender needs a receiver, transport, credentials where applicable, and a mapping from facility, severity, host, service, and labels into the central record. A generic rsyslog TCP action can look like this:
action(
  type="omfwd"
  Target="collector.example.com"
  Port="514"
  Protocol="tcp"
)
A UDP destination can use the same conventional syslog port, but UDP doesn't provide the delivery behavior expected from a reliable incident pipeline. TCP is usually easier to reason about, while a relay with queues can isolate application hosts from collector outages.
A comparable syslog-ng destination is:
destination d_remote {
    tcp("collector" port(514));
};
Teams using rsyslog can select output modules for HTTP JSON or GELF when the receiving system requires those formats. An HTTP path needs a receiver-specific JSON contract and authentication configuration. GELF needs a GELF-compatible receiver and its framing expectations. These details shouldn't be guessed from the transport name alone.
For OpenTelemetry environments, a host collector such as a generic telemetry agent can export OTLP over HTTP. The receiver must expose an OTLP endpoint and define the expected authentication and payload format. That path is different from a dedicated Syslog, GELF, StatsD, Fluent Forward, or Beats destination, even when all records eventually reach the same central account.
For a concrete Linux routing workflow, see the syslog forwarding guide. With Fluxtail, supported HTTP JSON and OTLP receivers use TLS on port 443 and receiver-bound Bearer credentials. Dedicated Syslog, GELF, StatsD, Fluent Forward, and Beats destinations are separate ingestion paths, so the configured receiver must match the sender's protocol.
Once records arrive, named streams keep host or environment sources organized. Live Tail can then narrow records by time, stream, message, severity, host, service, namespace, labels, and Kubernetes metadata where those fields are present. The useful design choice is made upstream: preserve facility and severity, emit stable service and host identity, and attach labels consistently. Central filtering is only as precise as the fields that arrive.
Investigating Centralized Linux Logs in Live Tail and via MCP
After forwarding is verified, an engineer should open the relevant named stream rather than search an undifferentiated account. In Live Tail, the investigation can narrow by severity, host, service, unit, or available labels, then expand the time range only when the first query doesn't explain the failure.
A practical sequence is:
- Start with the incident window. Filter the affected host and service.
- Compare severities. Look for warnings and errors around the first symptom.
- Check facets. Break records down by host or service to distinguish one-node failure from fleet-wide behavior.
- Inspect exceptions and summaries. Use exception discovery and error summaries to reduce repetitive messages.
- Diagnose missing logs. Confirm whether the issue is a producer failure, local persistence problem, forwarding route, or central receiver configuration.
The same account can be queried through Fluxtail's hosted OAuth MCP server from Codex, Claude Code, Gemini CLI, and VS Code. Supported read workflows include log queries, histograms, facets, exception discovery, error summaries, missing-log diagnosis, health checks, and setup suggestions. Mutating MCP actions require a short confirmation token, so the workflow doesn't imply autonomous remediation or unrestricted writes.
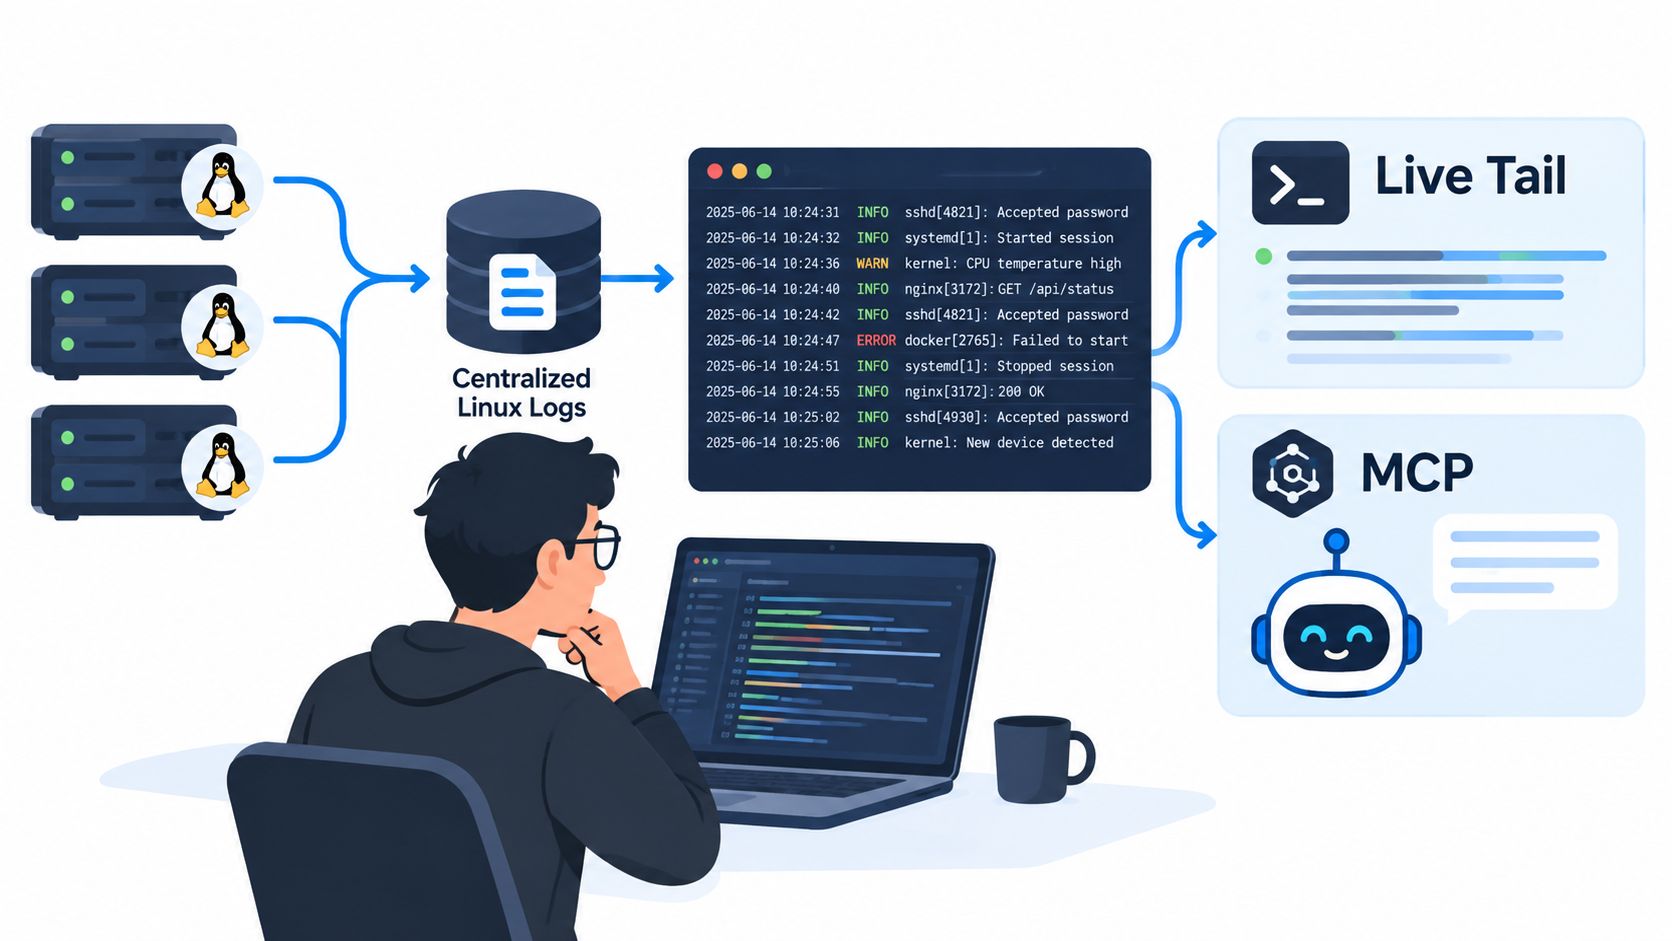
Centralized collection doesn't replace journalctl. It gives the incident commander a fleet view while the host-local tool retains its value for boot history, socket behavior, and records that haven't been forwarded. The broader operational rationale is covered in this guide to centralized log management.
Fluxtail provides centralized log management with named streams, Live Tail, precise search and filtering, alerts, built-in AI chat, and a hosted MCP server for agent-driven investigation. Engineers can register through the public Starter or Pro plans and connect a supported MCP client when Linux logs need searchable, multi-host context. Visit Fluxtail to set up a centralized logging workflow for the next incident.