
At 02:00, an SRE needs to determine why checkout requests are failing. Plain-text output shows interleaved messages from several instances, multiline stack traces, and thread names that don't identify the request. The search turns into a slow exercise in guessing which lines belong together.
Spring Boot structured logging changes that investigation from text matching to field filtering. Spring Boot 3.4 made structured output a native capability, so a service can emit JSON locally, attach consistent request context, validate the result, and ship searchable events without combining incompatible custom Logback and Log4j2 recipes. The practical path is straightforward: configure one built-in format, add correlation fields, validate every event, choose a transport, then investigate by service, severity, host, and trace identifiers.
Table of Contents
- Why Plain Text Logs Slow Down Incident Response
- How Native Structured Logging Works in Spring Boot
- Configure JSON Logging for Spring Boot 3.4 and Later
- Add Correlation IDs and Request Context With MDC
- Ship Validate and Tune Logging for Production
- Search Filter and Investigate Logs in Fluxtail
Why Plain Text Logs Slow Down Incident Response
Plain text logs work for a developer watching one process. They become difficult during an incident because the useful relationships exist only in human interpretation. A message may contain a timestamp and severity, but the service name, request identifier, tenant context, and trace information might be absent, embedded in inconsistent text, or printed on separate lines.
That creates predictable failure modes:
- Multiline ambiguity: A stack trace can be separated from the request that caused it when several instances write to a shared destination.
- Inconsistent terminology: One service may write
WARN, another may writewarning, and a third may encode the state inside the message. - Weak filtering: Searching for a phrase such as
timeoutcan return health checks, retry messages, and unrelated failures. - Context loss: Asynchronous work may continue after the original request thread has changed, leaving operators without the identifiers needed to follow the operation.
A structured event turns those values into fields. An investigator can filter for service=checkout, severity=ERROR, and a particular traceId, rather than reconstructing an event from nearby lines. The log message remains useful for humans, but the surrounding metadata becomes usable by search, dashboards, alerts, and investigation tools.
Practical rule: JSON output isn't observability by itself. It becomes operationally valuable only when the receiving system parses the selected format and preserves the fields needed for investigation.
Spring Boot 3.4 provides the native path used in this guide. The application emits JSON first, then adds MDC and tracing context, sends the output through a suitable receiver, and exposes the resulting fields for human and agent-assisted investigation. The application code still logs through the normal logging API. The main change is the event shape and the discipline around its fields.
How Native Structured Logging Works in Spring Boot
Spring Boot structured logging became a first-class feature in Spring Boot 3.4, released in November 2024, after structured logging support appeared during the same release cycle. The Spring project documents three built-in formats: Elastic Common Schema, Graylog Extended Log Format, and Logstash. They can be selected through properties such as logging.structured.format.console=ecs and logging.structured.format.file=logstash, and Spring's documentation states that the built-in formats require no extra dependencies. See the Spring announcement for structured logging in Spring Boot 3.4 for the release context.
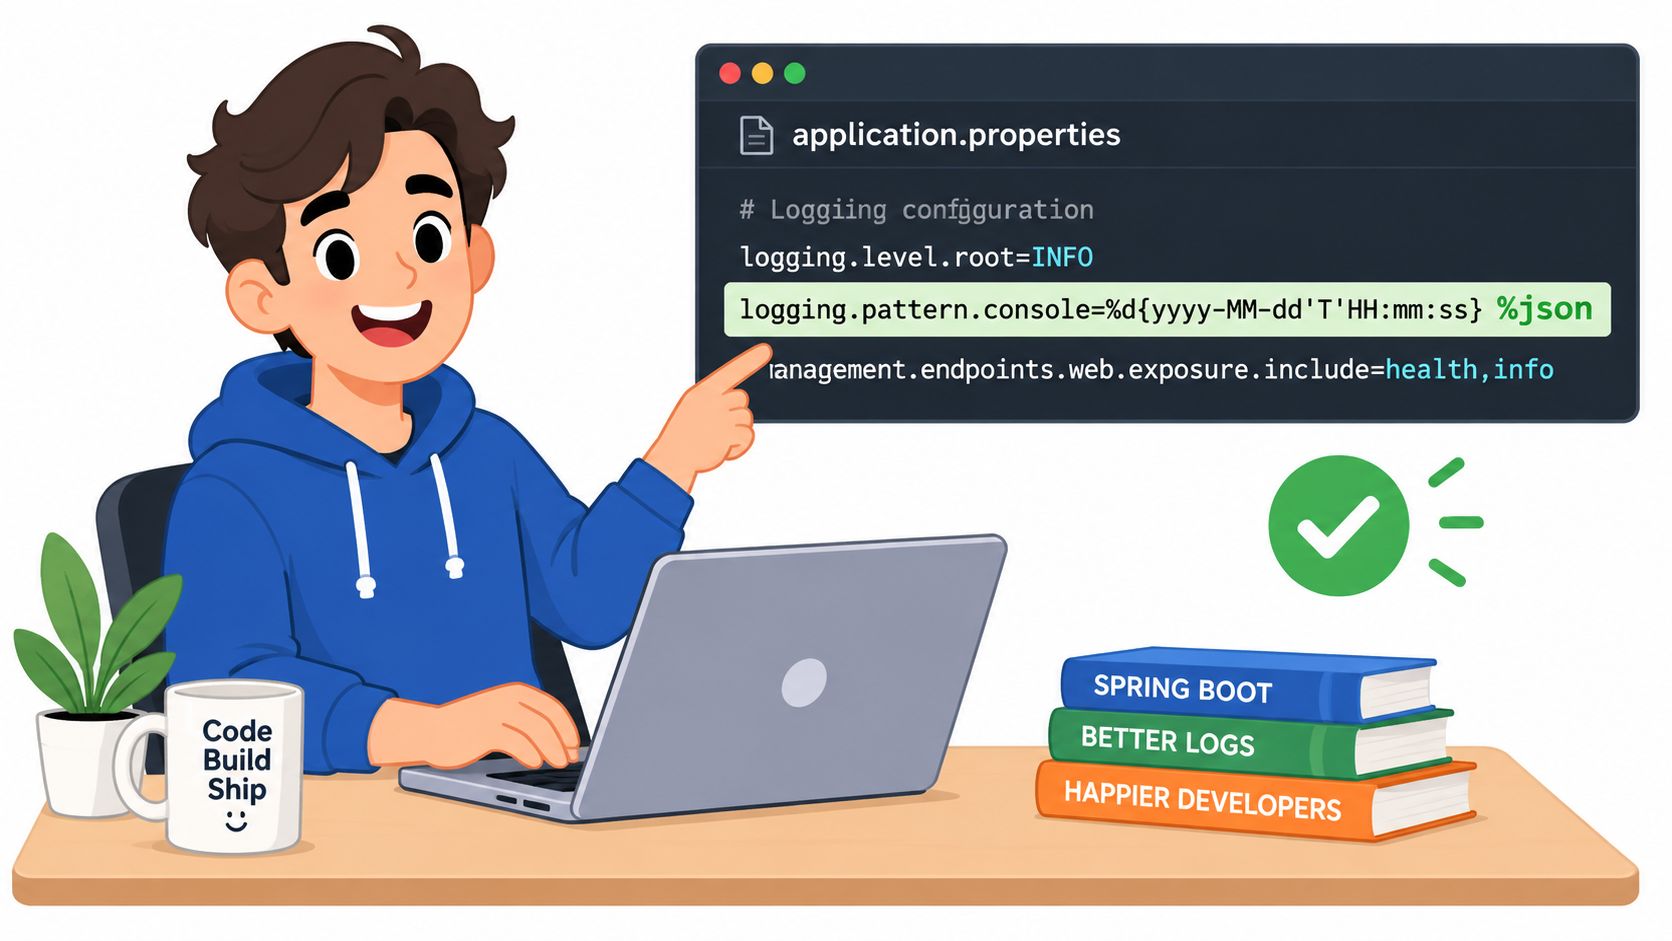
The native approach avoids a common maintenance trap. Hand-built JSON appenders and encoder configurations often make formatting dependent on a particular backend, configuration file, and dependency combination. Spring Boot's built-in properties provide a consistent starting point while leaving room for extension when a required schema doesn't match the provided formats.
Choose the format deliberately
A team should choose the format that matches the receiving pipeline, not the one that produces the most attractive local output. ECS is a sensible choice when the destination already understands ECS field conventions. GELF can fit a pipeline designed around that event format. Logstash is useful when the ingestion side expects Logstash-style JSON fields.
Spring Boot's logging reference also documents StructuredLogFormatter for custom formats. The API supports Logback and Log4j2 through the appropriate generic log-event type, so an organization can extend the native platform without pretending that a custom formatter is the same thing as a built-in format.
Spring Boot 3.4 retained the Java 17 and Jakarta EE 9 baselines while adding structured logging. That means an organization can adopt native structured output without changing that runtime floor. The capability continued to evolve afterward, with Spring Boot 3.5 release notes documenting a nested JSON update for ECS structured logging. The current Spring Boot logging reference is the authority for the available properties and extension points.
Configure JSON Logging for Spring Boot 3.4 and Later
The simplest complete path uses Spring Boot's built-in structured logging properties. The following example is labeled for Spring Boot 3.4 and later and uses the built-in ECS format for console output. It deliberately avoids a custom Logback or Log4j2 configuration.
Add the production profile properties
Create application-prod.properties:
spring.application.name=checkout-service

logging.structured.format.console=ecs
This configuration sends structured ECS output to the console, which is usually the cleanest container deployment path because the runtime or collector can read standard output. A file format can be selected separately when the service is intentionally writing application-managed files:
logging.structured.format.file=ecs
A deployment should select the destination it uses. It shouldn't enable a file formatter merely because a file exists somewhere in a local development environment.
Keep local development readable if developers need compact console messages, then enable ECS through the production profile:
# application-dev.properties
spring.application.name=checkout-service
logging.structured.format.console=

# application-prod.properties
spring.application.name=checkout-service
logging.structured.format.console=ecs
The empty value in the development example represents the absence of a structured format selection. The production profile contains the meaningful setting. Teams should confirm the active profile and effective configuration rather than assuming that a local run matches production.
Produce and validate one event
An illustrative application log call might look like this:
private static final Logger log =
        LoggerFactory.getLogger(CheckoutService.class);

public void authorize(String orderId) {
    log.info("Payment authorization started");
}
With ECS enabled, the exact field set depends on the active Spring Boot and logging configuration, but the event should be valid JSON and should expose structured fields rather than one escaped JSON string inside a message. A representative event shape is:
{
  "@timestamp": "2025-01-15T10:30:00Z",
  "log.level": "INFO",
  "log.logger": "com.example.checkout.CheckoutService",
  "message": "Payment authorization started",
  "service.name": "checkout-service",
  "host.name": "checkout-7f9c"
}
The example is illustrative, not a claim about a fixed output schema for every application. The receiving pipeline should validate the actual event produced by the deployed Spring Boot version.
For a local check, capture one line and parse it with jq:
java -jar target/checkout-service.jar \
  --spring.profiles.active=prod 2>&1 | jq -c .
A valid event should pass JSON parsing. A useful smoke test also checks that the expected application name and level are present:
java -jar target/checkout-service.jar \
  --spring.profiles.active=prod 2>&1 \
  | jq -e 'select(.message != null and .["log.level"] != null)'
Don't mix a Logback logback-spring.xml JSON encoder with a Log4j2 JSON layout in the same setup. Choose the backend used by the application, keep the native Spring Boot property path intact, and introduce a custom backend configuration only when the built-in formatter cannot satisfy a documented requirement.
Add Correlation IDs and Request Context With MDC
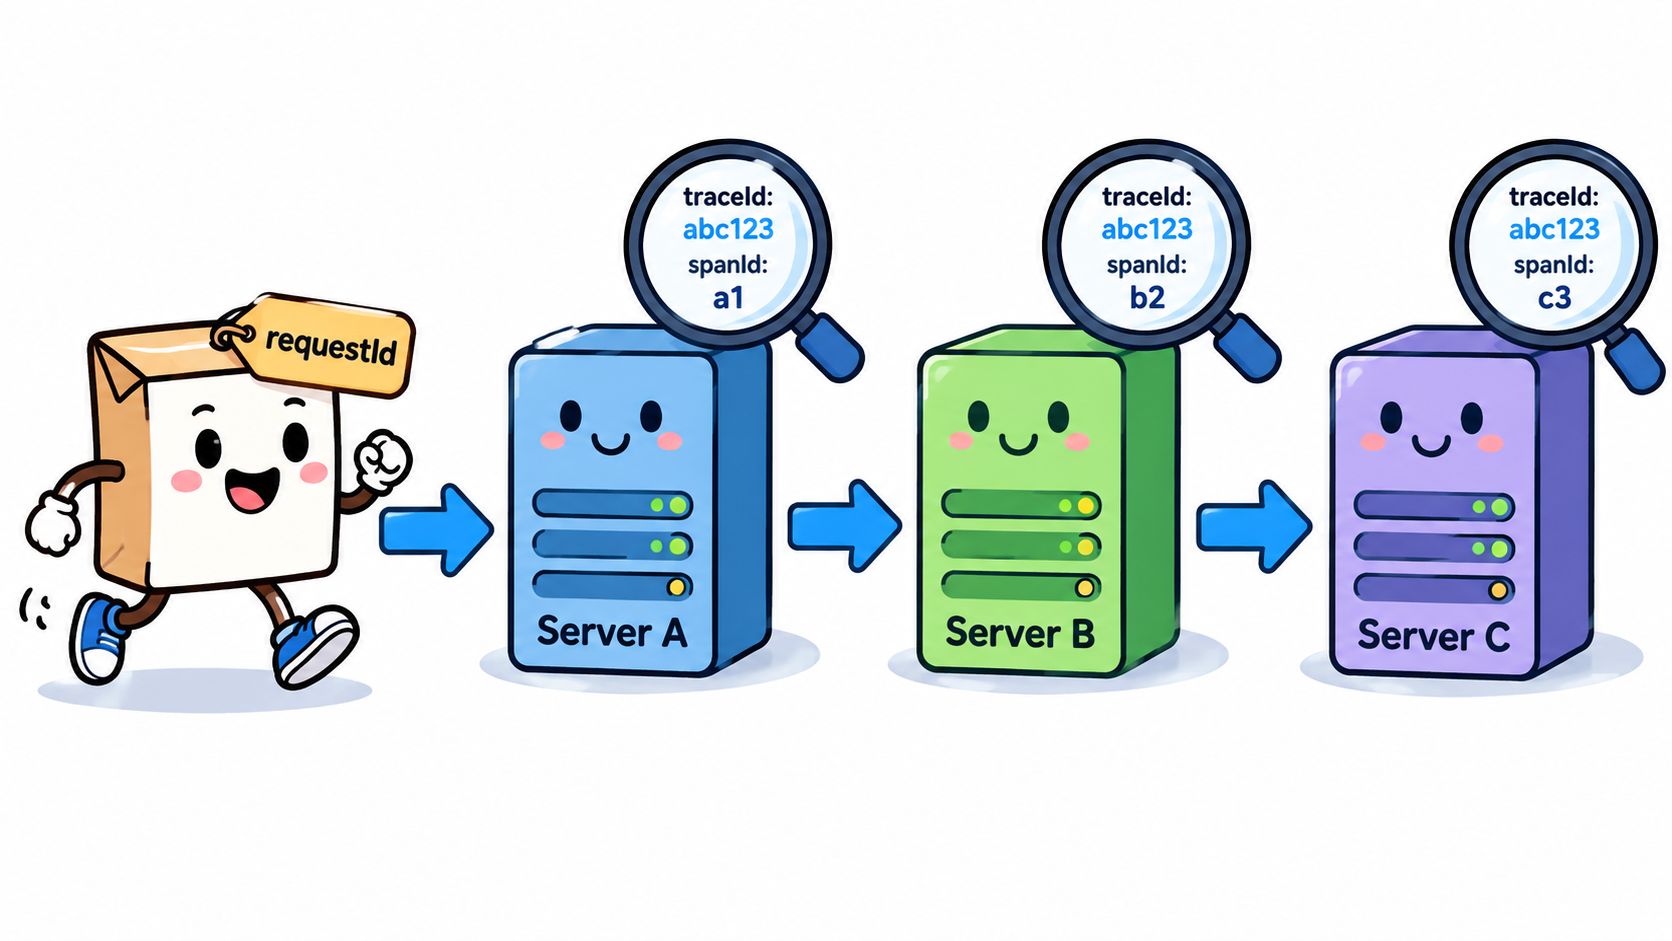
JSON makes fields searchable, but it doesn't automatically make a request traceable across boundaries. The application still needs a consistent context model. Common fields include traceId, spanId, requestId, service, environment, and a carefully chosen business context such as a tenant identifier.
When Micrometer Tracing is on the classpath, Spring Boot states that logs are correlated automatically by default. The default correlation value is composed from the traceId and spanId MDC values, and Spring documents the emitted form as [traceId-spanId]. The logging.pattern.correlation property can override that pattern, as described in the Spring Boot tracing documentation.
Add request-scoped fields safely
For request-specific values not supplied by tracing, a servlet filter can populate MDC and clear it when the request ends:
@Component
public class RequestContextFilter extends OncePerRequestFilter {

    @Override
    protected void doFilterInternal(
            HttpServletRequest request,
            HttpServletResponse response,
            FilterChain filterChain)
            throws ServletException, IOException {

        String requestId = request.getHeader("X-Request-Id");

        if (requestId == null || requestId.isBlank()) {
            requestId = UUID.randomUUID().toString();
        }

        try (MDC.MDCCloseable ignored =
                     MDC.putCloseable("requestId", requestId)) {
            filterChain.doFilter(request, response);
        }
    }
}
The try scope matters. Thread pools reuse threads, so stale MDC values can leak into a later request if the context isn't removed. Header values also need normal validation and size controls before they enter logs.
A service can add a temporary business field around a narrow operation:
try (MDC.MDCCloseable ignored =
             MDC.putCloseable("orderId", orderId)) {
    log.info("Payment authorization started");
}
Field names must stay stable across services. A pipeline that alternates between request_id, requestId, and correlation forces operators to search multiple fields and makes cross-service queries fragile. Async execution creates another boundary. MDC is thread-local, so executors need a task decorator or equivalent context propagation mechanism that copies the required values into the worker thread and clears them afterward.
The microservices logging guidance provides related field-design context for services that need consistent correlation across boundaries.
Keep context useful and safe
Correlation fields should identify an operation, not expose secrets. Tokens, passwords, authorization headers, and unrestricted request bodies don't belong in ordinary application logs. Tenant or user fields also need an intentional privacy and access policy.
A practical event should answer four questions quickly:
- Which service emitted it?
- How severe is the event?
- Which request or trace does it belong to?
- What operation or state does the message describe?
That narrow schema is more valuable than adding every available attribute. It also makes downstream filtering predictable.
Ship Validate and Tune Logging for Production
Once the application emits valid JSON, transport becomes an operational decision. Fluxtail distinguishes shared HTTP JSON and OTLP receivers on TLS port 443, using receiver-bound Bearer credentials, from dedicated Syslog, GELF, Fluent Forward, and Beats destinations. The correct choice depends on the collector already present, the format expected by the receiver, and how much infrastructure the team wants to operate.
A Spring Boot service writing JSON to standard output can use a collector or an HTTP JSON path. A platform already centered on OpenTelemetry may prefer OTLP. GELF or Syslog makes more sense when an existing forwarding layer already speaks that protocol. The receiver must parse the event as structured data, not store the entire JSON document as an opaque message string.
Compare the transport choices
| Transport | Best For | Parsing Notes | Operational Trade-off |
|---|---|---|---|
| HTTP JSON | Direct structured event delivery | Send JSON objects through the shared receiver and preserve field types | Simple application path, but credential and retry handling still need operational ownership |
| OTLP | Environments standardized on OpenTelemetry | Use the receiver's expected OTLP log representation | Fits an existing telemetry pipeline, with more pipeline conventions to maintain |
| Syslog | Existing syslog forwarding | Confirm how structured fields are mapped from the syslog payload | Broad operational familiarity, but parsing depends on the selected message structure |
| GELF | A GELF-oriented forwarding path | Keep GELF fields aligned with the receiving parser | Useful when GELF already exists, but adds format-specific decisions |
| Fluent Forward or Beats | Existing collector-based pipelines | Validate field mapping at the collector and destination | Avoids changing the application transport, while increasing pipeline components |
The structured logging best-practices guide is relevant when standardizing the fields before ingestion.
Control volume and prove delivery
Use INFO for business events, WARN for degraded states, and ERROR only for actionable failures. DEBUG should stay disabled globally in production because excess volume hides important events and increases storage and I/O pressure. Local logs are commonly retained for roughly 7 to 30 days before rotation or archival, a practical balance between investigation depth and disk growth, as discussed in Spring Boot logging guidance.
High-throughput services may use asynchronous appenders. Queue size and discard policy need deliberate tuning. A queue that blocks request threads can throttle the application, while a queue that discards events can remove the evidence needed during an incident. Sampling can reduce repetitive low-value events, but it shouldn't remove error context or the correlation fields required to reconstruct a failure.
Validation should cover the whole path:
- Confirm the application produces one valid JSON object per event.
- Confirm the receiver accepts the selected authentication and transport.
- Confirm the destination preserves
service, severity, host, and trace fields. - Generate a known test event and find it in the expected named stream.
- Use missing-log diagnosis and health checks when events don't appear.
A successful local jq parse proves only the formatter. It doesn't prove delivery, parsing, indexing, or retention.
Search Filter and Investigate Logs in Fluxtail
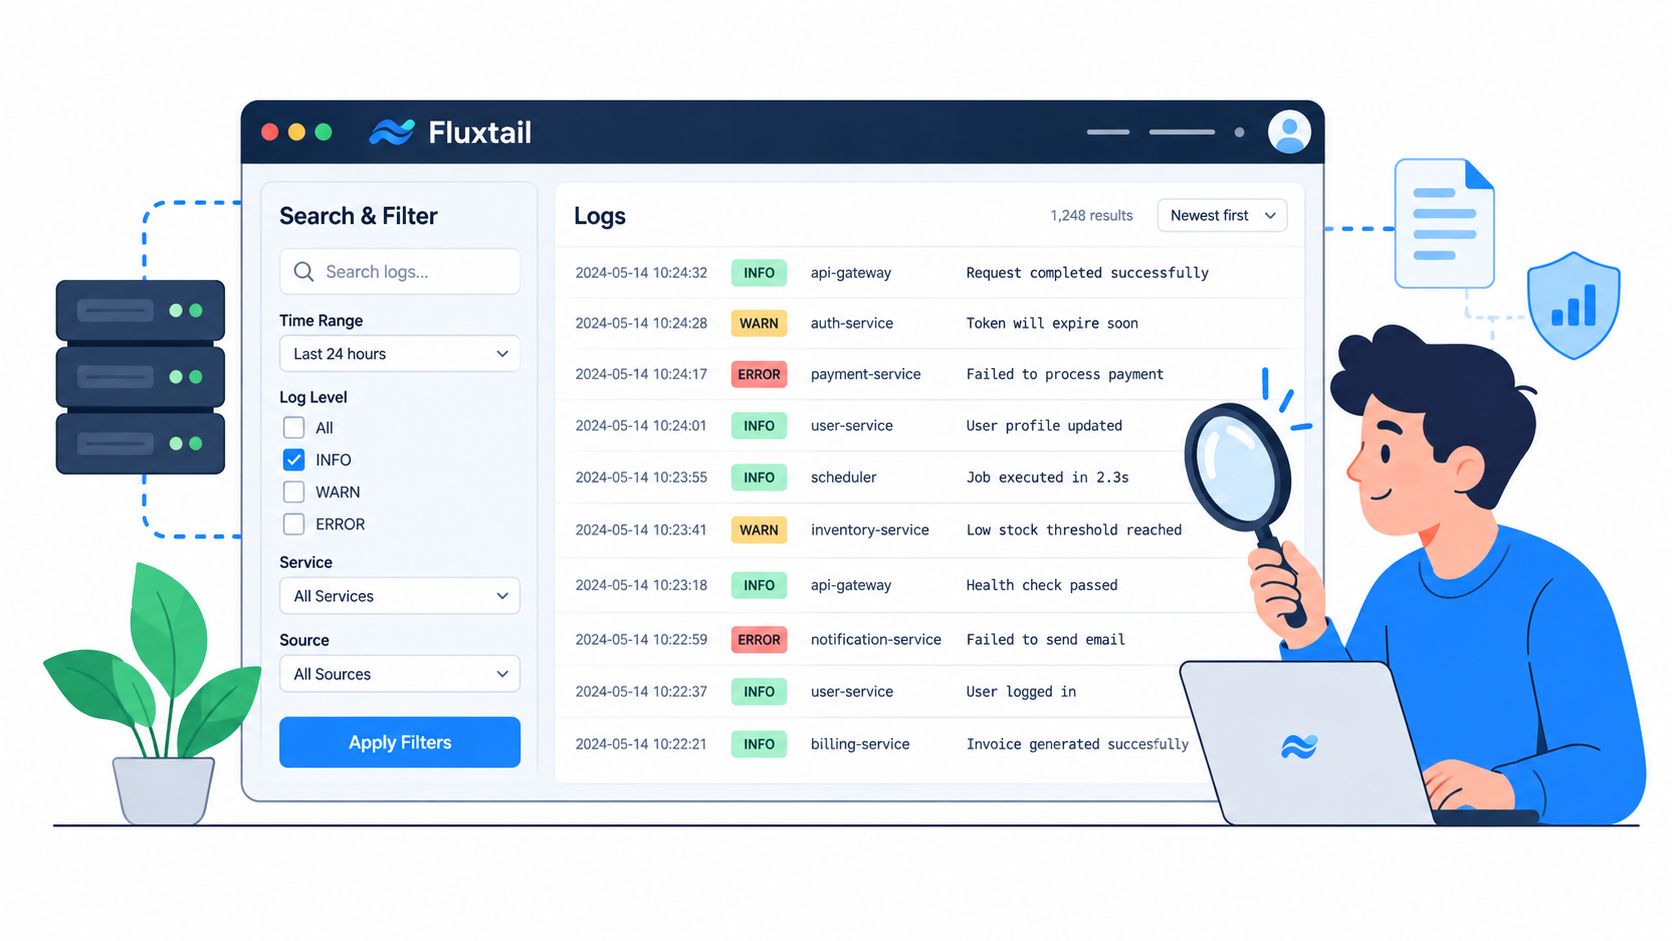
The fields created earlier become useful when an incident view can filter them directly. In Fluxtail Live Tail, an operator can narrow events by time, stream, message, severity, host, service, namespace, labels, and Kubernetes metadata, then focus on a trace identifier or exception field instead of scanning unrelated text.
A practical investigation sequence starts broad and becomes specific:
- Filter the affected service and time window.
- Narrow to
ERRORandWARNevents. - Filter by
traceIdorrequestId. - Inspect exception discovery and error summaries.
- Compare the affected stream with nearby service or host fields.
Fluxtail's data ingestion example is useful when checking how events enter a centralized account. The same account can also be queried through the hosted OAuth MCP server from Codex, Claude Code, Gemini CLI, and VS Code. Supported read workflows include log queries, histograms, facets, exception discovery, error summaries, missing-log diagnosis, health checks, and setup suggestions. Mutating MCP actions require a short confirmation token, so the workflow supports investigation without implying autonomous remediation or unrestricted writes.
Live Tail serves the human search path, while the MCP documentation supports the agent-driven path. Public self-service registration is available through Fluxtail's registration page, with Starter and Pro plans described on the pricing page.
The durable pattern is simple: Spring Boot emits native structured JSON, MDC and tracing supply context, the transport preserves fields, and the investigation layer turns those fields into filters and queries.
Connect a Spring Boot service to Fluxtail after validating its JSON output, then use Live Tail to filter by service, severity, host, and trace fields. Teams using Codex, Claude Code, Gemini CLI, or VS Code can also connect the hosted MCP server for agent-driven log queries, histograms, exception discovery, and health checks.