
At 3 a.m., a payments service starts returning 500 errors. An SRE connects to a bastion host, opens an SSH session, and runs tail -f /var/log/app/payments.log. The command works until log rotation replaces the file, the application goes quiet, or the useful error is buried under a stream of access records.
A reliable log file tail workflow starts with one distinction: a path identifies a filename, while a file descriptor identifies an already-open file. Tailing means holding a read offset and streaming newly appended bytes through that open handle, not rereading the file from the beginning. That distinction explains rotation, truncation, incomplete multiline records, and why a live tail can appear healthy while missing new output.
Table of Contents
- What Tailing a Log File Actually Means
- A Short History of the Tail Command
- Core Tailing Commands for Production
- Filtering and Coloring the Live Stream
- Rotation, Multiline Records, and Truncation Pitfalls
- Why a Live Tail Suddenly Goes Silent
- When Terminal Tail Stops Scaling
- Centralized Live Tail With Named Streams
- Agent-Driven Investigation Through MCP
- Quick Reference and Severity Cheat Sheet
What Tailing a Log File Actually Means
The tail command initially reads the end of a file, then follow mode keeps reading as additional bytes arrive. In practical terms, the process remembers where it stopped and waits for more data. The filename is only how the process finds the file at startup, unless the command is explicitly told to keep resolving that name.
That matters during incidents. A process can continue following the old inode after an administrator renames the log and creates a new file at the same path. The terminal still shows a valid stream, but the application is now writing somewhere else.
Practical rule: Treat every silent tail as an investigation, not proof that the application is idle.
The core commands are straightforward:
- Follow an ordinary file:
tail -f /var/log/app/payments.log - Follow a rotated file by name:
tail -F /var/log/app/payments.log - Inspect recent output interactively:
less +F /var/log/app/payments.log - Follow a systemd service:
journalctl -f -u payments.service
The rest of the workflow depends on knowing which storage system contains the records, how rotation is implemented, and whether each event occupies one line or several.
A Short History of the Tail Command
The Unix tail command appeared in Bell Labs' Version 7 Unix in 1979, and POSIX standardized it in 1992. During the 1980s, tail -f made continuous log watching practical instead of requiring repeated manual checks. The syntax history is summarized in this history of the Unix tail command.
Option syntax also reflects Unix portability concerns. POSIX standardized -n NUM in place of the older -NUM form, giving scripts a clearer interface across Unix systems. Use the portable form in production:
tail -n 200 /var/log/app.log
The command's historical filename interface can hide a modern operational boundary. tail opens a file and follows the resulting descriptor, while follow-by-name behavior depends on the selected implementation and mode. That distinction matters when a path is replaced during rotation: the process may still read the old descriptor even though the filename now identifies a new inode.
Implementations can use polling or operating-system notifications. Treat that mechanism as an implementation detail. The reliable contract is to read the current end and follow appended data according to the chosen mode.
Core Tailing Commands for Production
The safest command depends on where the logs live and whether the filename will survive rotation.
| Command | Syntax | Best For | Rotation Behavior |
|---|---|---|---|
tail -f |
tail -f /var/log/app.log |
A stable file during a short investigation | Follows the open descriptor |
tail -F |
tail -F /var/log/app.log |
Long-running production watches | Follows the name and retries reopening |
less +F |
less +F /var/log/app.log |
Follow mode plus backward search | Depends on the file being reopened or revisited |
journalctl -f |
journalctl -f -u nginx |
Logs held in the systemd journal | Journal manages its own storage |
tail -f is concise and useful when the application writes continuously to the same file. For a host where log rotation can rename and recreate that file, tail -F is the better default. GNU documents -F as the shorthand for following by name with retry behavior, so the command can wait for the replacement file to appear after rotation. See the GNU tail follow documentation.
less +F is useful when the incident requires both live output and historical inspection. Press Ctrl+C to stop following, search with /pattern, move through earlier records, and press F to resume follow mode. This avoids opening a second terminal merely to inspect context before the current event.
For systemd-managed services, use the journal directly:
journalctl -f -u nginx
A file may be absent because the service writes only to the journal binary. In that case, searching /var/log won't help. For a container stream, use the runtime or orchestration command that exposes the container's output, for example:
kubectl logs -f pod-name
The exact object and namespace still need to match the workload being investigated.
Filtering and Coloring the Live Stream
A raw stream is often too noisy to support good incident decisions. Filters should narrow the view without destroying the original evidence. The simplest pattern keeps the producer connected to a line-buffered filter:
tail -F /var/log/app.log | grep --line-buffered -iE 'error|warn|timeout'
--line-buffered helps matching records appear promptly instead of waiting for a larger output buffer. Case-insensitive matching catches inconsistent application capitalization, while extended regular expressions keep related terms in one expression.
For severity words, a boundary-aware pattern avoids matching unrelated text:
tail -F /var/log/app.log | grep --line-buffered -iE '\b(err|warn|emerg|crit)\b'
That filter is useful for human-readable logs, but it isn't a substitute for a structured severity field. A JSON record containing "severity":"error" should be parsed according to its schema rather than searched as arbitrary text.
| Pattern | Command | What It Does |
|---|---|---|
| Case-insensitive terms | grep --line-buffered -iE 'error|timeout' |
Keeps matching records visible |
| Severity words | grep --line-buffered -iE '\b(err|warn|emerg|crit)\b' |
Narrows common urgency terms |
| Field condition | awk '$5 == "ERROR" {print}' |
Selects records by a whitespace-delimited field |
| Numeric threshold | awk '$7 >= 500 {print}' |
Shows records whose selected field meets a condition |
| Colorized matches | grep --color=always -iE 'error|warn' |
Highlights matching text in a terminal |
| Exclusion | grep --line-buffered -v 'healthcheck' |
Removes known repetitive records |
awk is powerful only when the record format is stable. Access logs with quoted fields, embedded spaces, or JSON should be parsed with a format-aware tool or centralized search instead of relying on guessed field positions. sed can remove predictable prefixes, but destructive cleanup should never replace the untouched source during an incident.
Rotation, Multiline Records, and Truncation Pitfalls
Rotation exposes the difference between a filename and a file descriptor. A rename-and-create scheme moves the old inode elsewhere, then creates a new file at the original path. Descriptor-following tail -f can remain attached to the old inode, while tail -F follows the filename and retries until the replacement exists. The Linux manual describes -F as following by name with reopen behavior, which is why it fits long-running watches on rotated logs. The Linux tail manual documents the underlying follow options.
Truncation is different. An application or rotation hook may preserve the inode but reduce its length. A follower must detect that the current offset is no longer valid and continue from the appropriate position. Operators should check the application's write mode and rotation policy rather than assuming every silent period has the same cause.
Multiline records create another failure mode. A stack trace may begin with an error line and continue across indented lines, but ordinary grep treats each physical line as an independent record. A match can therefore show the exception header without its useful context, while a filter can accidentally discard continuation lines.
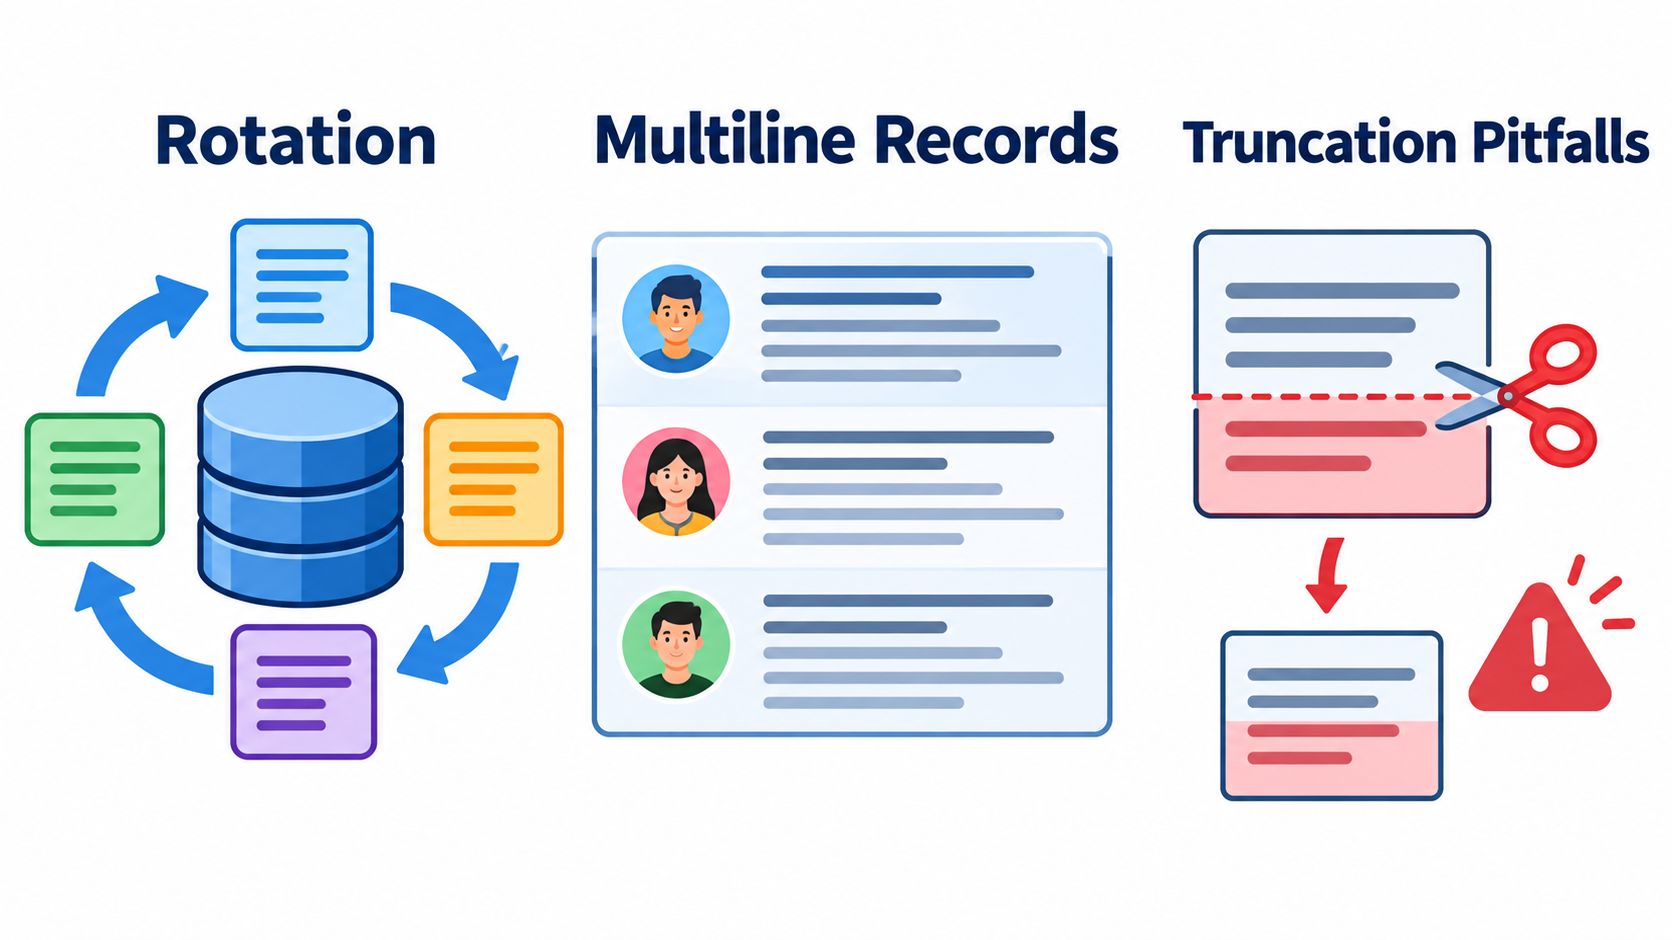
For structured parsing and multiline handling, teams should define how a record starts, how continuation lines attach, and where the assembled event is stored. The log parsing guide covers that design concern separately.
Why a Live Tail Suddenly Goes Silent
A production tail can go quiet even while the service appears healthy. The application may have stopped writing, the configured path may be wrong, permissions may block reads, or output may have moved to the system journal. Rotation can also leave a process attached to an obsolete file descriptor and inode.
| Layer | Symptom | First Check | Fix |
|---|---|---|---|
| Application | No new events anywhere | Check service state and request activity | Restore traffic or investigate the service |
| Path | File exists but timestamp doesn't change | Verify the configured output path | Tail the active path |
| Permissions | tail reports access failure |
Inspect ownership and access rights | Use approved group access or privilege |
| Rotation | Old records remain visible | Compare inode and file metadata | Use tail -F and review rotation hooks |
| Journal | Text file stays idle | Query the unit with journalctl |
Follow the journal source |
| Pipeline | One source is quiet while others work | Check collector health and receiver status | Repair the source or ingestion route |
Check the file's modification time, inode, size, and writer process together. A file can exist without receiving data, and a successful tail process can still follow the wrong object. The practical question is which file descriptor receives new writes, not whether a familiar filename remains on disk. For centralized pipelines, check source status, stream activity, credentials, and receiver selection.
Collectors that tail files typically track inodes and persist offsets so they can resume after a restart. That state also affects rotation: a collector may follow the old object, reopen the replacement, or read the same records twice if wildcard matching and offset handling are poorly configured. Use explicit targets where possible, keep position state durable, and verify behavior during a controlled rotation. The Fluentd tail input guidance provides operational context for following log files.
A quick diagnostic sequence narrows the fault:
stat /var/log/service.log
lsof /var/log/service.log
ps -ef | grep service
tail -F /var/log/service.log
If lsof shows a different inode or path, the filename is no longer the right investigation target. If no writer holds the expected file, inspect the service configuration and journal before restarting the follower.
When Terminal Tail Stops Scaling
A terminal tail works well for one host, one service, and one immediate question. During an incident spanning hosts, services, regions, or deployment units, it becomes difficult to operate. Separate SSH sessions create separate clocks, scrollback, and evidence trails, so the investigator must mentally align streams before deciding what happened.
Remote access adds failure points. SSH can disconnect, an unfiltered pipe can overwhelm the session, and a local terminal can become unusable under a burst of records. Shell output also lacks a shared bookmark, durable replay, team-wide access boundary, and cross-host correlation view.
Choose the investigation boundary based on the question:
- Use a local tail when the source and scope are limited to one file.
- Use a journal query when the service writes only to the host journal.
- Use a centralized stream when several services must be inspected together or historical search matters.
- Use structured investigation when service, namespace, severity, request identifier, or region determines the result.
The underlying shift is from filenames to file descriptors and then to named streams. A local tail follows writes from one process on one host. A centralized stream preserves identity across hosts and lets an investigator compare related records without maintaining several terminals. That boundary also supports controlled access and replay after the live event has passed.
Centralized logging has become a substantial market category, but market projections are not a reason to centralize every diagnostic command. Keep local tailing for fast, low-scope checks where it provides the shortest path to an answer. Move to a centralized stream when correlation, retention, shared investigation, or multiple writers becomes part of the problem. The Unix pipe and log management background provides historical context for how shell pipelines support log handling, rather than serving as evidence for market-size estimates.
Centralized Live Tail With Named Streams
Centralized tailing changes the unit of investigation from a file on one host to a stream with an explicit identity. Fluxtail provides named streams, Live Tail, search, filters, alerts, built-in AI chat, and a hosted OAuth MCP server. Its documented ingestion paths distinguish shared HTTP JSON and OTLP receivers on TLS port 443, using receiver-bound Bearer credentials, from dedicated Syslog, GELF, StatsD, Fluent Forward, and Beats destinations. Teams should use the receiver and credential documented for the selected source, rather than assuming that one endpoint applies to every protocol.
A practical naming model can use environment, service, and region as separate dimensions, for example:
prod-apiprod-workerprod-edge
Those names are illustrative. The useful property is that each stream represents a deliberate operational boundary, while searchable fields retain details such as host, service, namespace, labels, and Kubernetes metadata. A human can select streams in Live Tail, narrow the time window, and filter by readable fields instead of joining several SSH outputs manually.
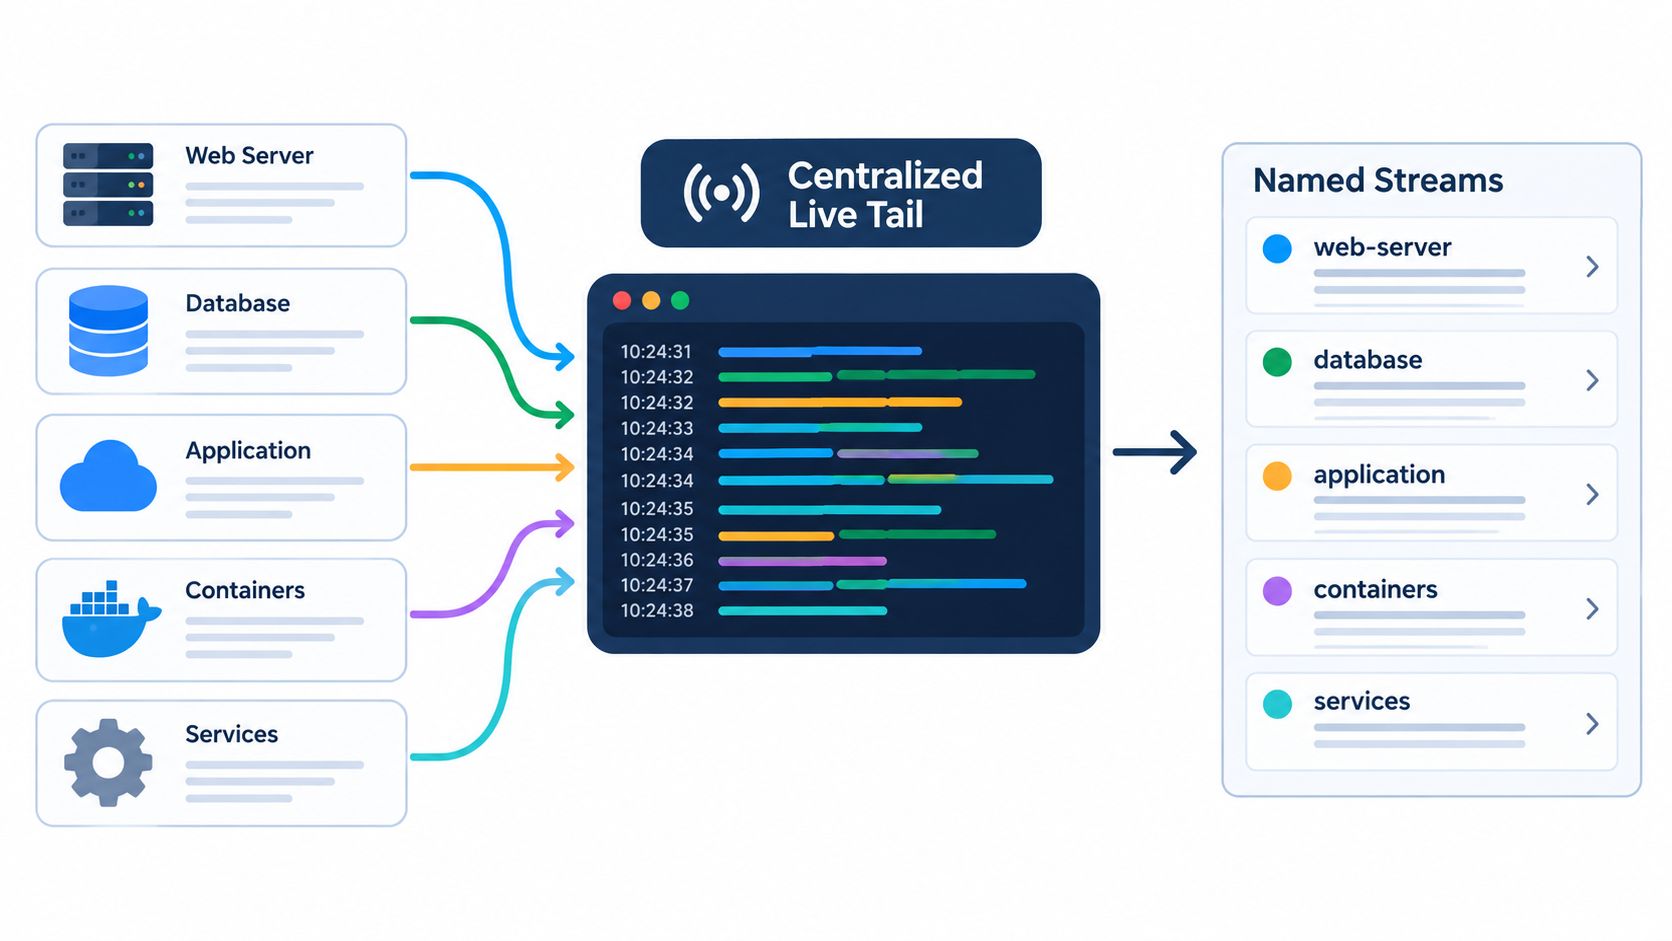
Illustrative investigation steps look like this:
- Select the relevant production streams.
- Restrict the time window around the incident.
- Filter by service, severity, namespace, or message.
- Exclude repetitive health checks when they obscure the failure.
- Compare the resulting records with a histogram or facet view.
The data ingestion example shows how source events enter a centralized workflow. Fluxtail also supports the human path through Live Tail and the agent path through its hosted MCP service, without requiring a separate account view for each investigation method.
Agent-Driven Investigation Through MCP
A hosted MCP server lets an MCP-compatible client query the same Fluxtail account used by the Live Tail interface. Supported clients include Codex, Claude Code, Gemini CLI, and VS Code. The read workflows cover log queries, histograms, facets, exception discovery, error summaries, missing-log diagnosis, health checks, and setup suggestions.
An operator connects the chosen client through Fluxtail's documented OAuth setup rather than inventing a local endpoint or token format. The available investigation actions can be described in terms such as list_streams, tail_stream, search_recent, and set_filter, but the client should use the current hosted MCP documentation for the exact tool schema and registration flow.
An illustrative prompt might ask:
“Inspect
api-prodfor the recent 500-error pattern, compare related request identifiers with failures inworker-prod, summarize the first observed error and likely dependency path, and identify whether either stream stopped receiving logs.”
The agent can return a concise incident summary containing the selected streams, matching records, grouped errors, and missing-log checks. That output still needs human review, especially when the investigation could lead to a change. MCP read operations are direct, while mutating actions require a short confirmation token. The service shouldn't be treated as autonomous remediation or unrestricted write access.
Quick Reference and Severity Cheat Sheet
Syslog severity has eight levels, numbered 0 through 7 in RFC 5424. The standard order appears in this syslog severity reference and the log severity levels guide.
| Severity | Code | 常用指令 | 用途 |
|---|---|---|---|
| Emergency | 0 | tail -f file |
追蹤檔案描述元 |
| Alert | 1 | tail -F file |
重新開啟輪替後的檔案 |
| Critical | 2 | journalctl -f -u unit |
追蹤 journal 單元 |
| Error | 3 | grep -E '\b(err|warn|emerg|crit)\b' |
篩選常見嚴重性字詞 |
| Warning | 4 | tail -n NUM file |
讀取最近幾行 |
| Notice | 5 | tail -f file | sed |
簡單清理串流 |
| Informational | 6 | journalctl -f |
追蹤整個 journal |
| Debug | 7 | tail -F file | awk |
篩選結構化欄位 |
輪替中的檔案使用大寫 -F。需要即時篩選時,套用即時串流篩選模式;遇到內容不完整,檢查輪替、多行記錄與截斷問題。單一檔案描述元已不足以呈現事件範圍時,改用具名串流的集中式即時追蹤。
Fluxtail 提供具名串流、Live Tail、搜尋與篩選、告警、內建 AI 聊天,以及 hosted MCP investigation。它也能集中查看多個來源,避免只盯著單一主機上的檔名。前往 Fluxtail 建立帳戶,或讓相容 MCP 的用戶端調查同一個帳戶。